When drafting an patent application that has components communicating or connected to each other or to a network, one or more figures showing system level interactions between the components should usually be included. Such figures are common in patents directed to software, methods, computers, or other electronics. As the Manual of Patent Examining Procedure provides, “In a typical computer [patent] application, system components are often represented in a ‘block diagram’ format, i.e., a group of hollow rectangles representing the elements of the system, functionally labeled, and interconnected by lines.” MPEP 2164.06(c).
One requirement in writing a patent application is to enable one skilled in the art area of the particular invention to be able to make and use the invention without undue experimentation from reading the patent application (which later may be come a patent). Drawings are a component of a patent application that convey to the reader, together with the written description, how to make and use the invention.
There are many different ways of representing system information in drawings. Why one patent shows a system drawing in one manner and anther patent shows a system drawing in a different manner is, many times, simply the result of the drafter’s choice. Often there is a choice of whether a particular detail is shown in drawings or is described in the text description only of the patent application. There is no bright line rule for making this determination. It may depend on the invention, the known prior art, the drafter’s preference, and/or other factors. When in doubt as to whether a detail needs to be shown in the drawings, show it in the drawings.
Below are a few examples of system drawings from US patents and published patent applications. After reviewing many different system diagrams you will get a feel for the variety in patent drawings.
Figure 1 of U.S. Patent Application Publication No. 2016/0062845 (the ‘845 publication) provides an example of a system diagram showing a number of different types of client devices 102, 108, 110 that can connect to the network 114.
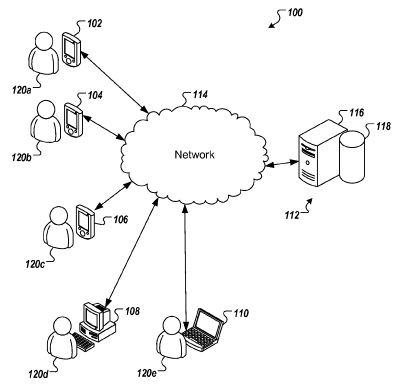
Figure 1 of US Patent No. 9,271,260 shows a basic system diagram. User devices 106A, 106B, and 106N are shown in two-way communication with a base station 102. The base station is shown in communication with a network 100. Note that the user devices a represented as as rectangle and not in 3D as is the case in Figure 1 of the ‘845 publication above.
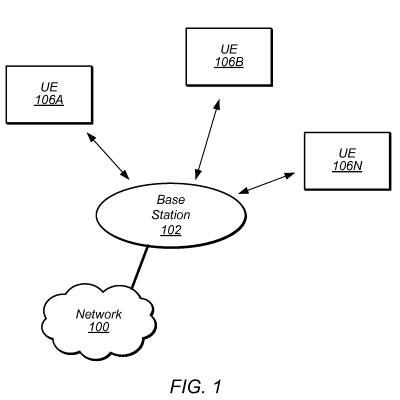
Figure 1 of U.S. Patent No. 9,277,582 provides another example of a relatively simple system diagram where the user device 106 is within range of each base station 102A and 102B.
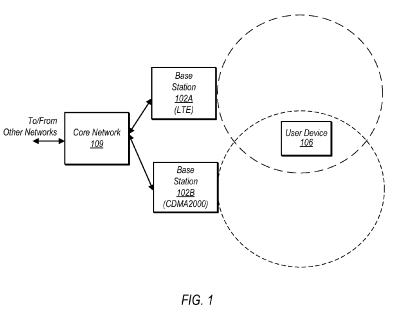
Figure 1 of U.S. Patent Application Publication No. 2016/0066134 provides another example of a system diagram where the venue 110 is shown as a three dimensional representation of a building. Three dimensional representation is usually not required, unless there is something important about the invention that needs to be demonstrated in in 3D.
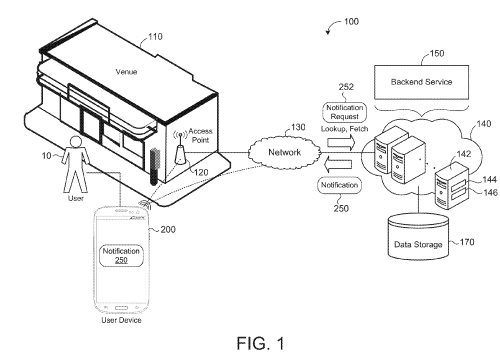
Figure 1 of U.S. Patent No. 9,227,535 provides a more detailed system diagram. It is possible that some complexity could have been removed from this figure and put into additional figures. For example, the details within items 30 and 40 could have been omitted from figure 1, but provided in other drawings in the application. Whether detail is provided in one drawing or is conveyed through multiple drawings is often a matter of the drafter’s choice.
Figure 1 of U.S. Patent No. 9,306,668 discloses a system of networked balloons. But the details of the balloons are not shown in figure 1. Instead they are shown in figure 3.
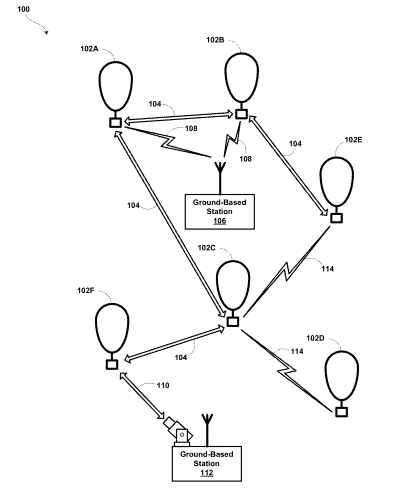
The balloon in figure 3 is labeled 300, which is different from the the labels of 102A, 102B, etc. in Figure 1. But the text description of the application provides that balloon 102A of figure 1 could be the balloon 300 shown and described in figure 3.
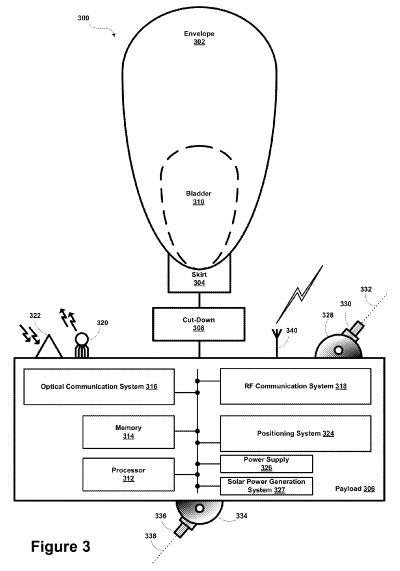
Figure 1 of U.S Patent No. 9,307,269 provides another example where components have shown internal additional details, such as the clients 123 and the Video Hosting Service 100.
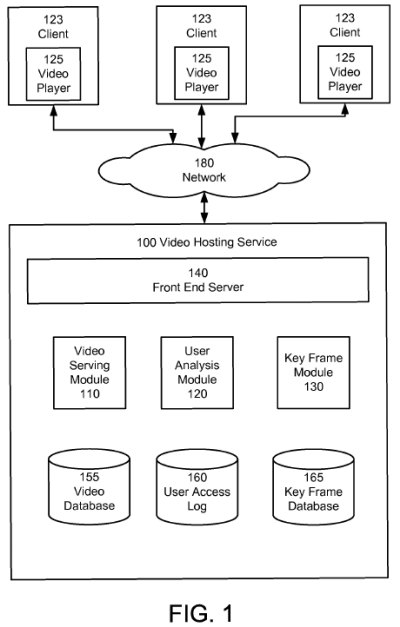
Figure 1 of U.S. Patent No. 9,277,363 shows the use of ellipses in drawings. The ellipse between server 120A and server 120N indicates that other servers can connected to network 140A.
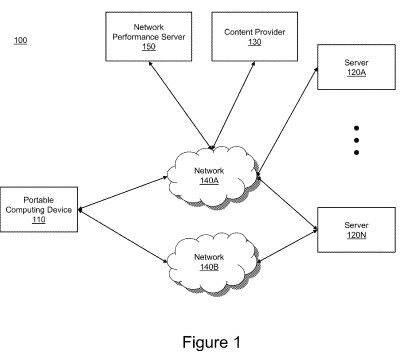
Figure 1 of U.S. Patent No. 9,307,466 discloses another example of a system diagram. Sometimes wireless communication is shown by a lighting bolt like symbol. However, a line with arrowhead could also be used in combination with a written description describing the communication between the two components being conducted wirelessly.
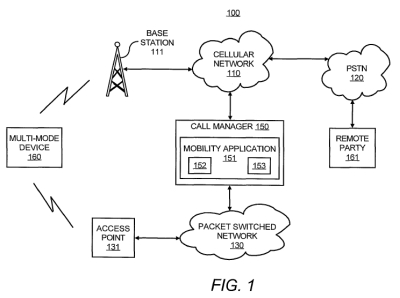
Figure 1 of US Patent No. 9,307,045 discloses another example of a system diagram. A cloud it often used to indicated a computer network, such as network 125.
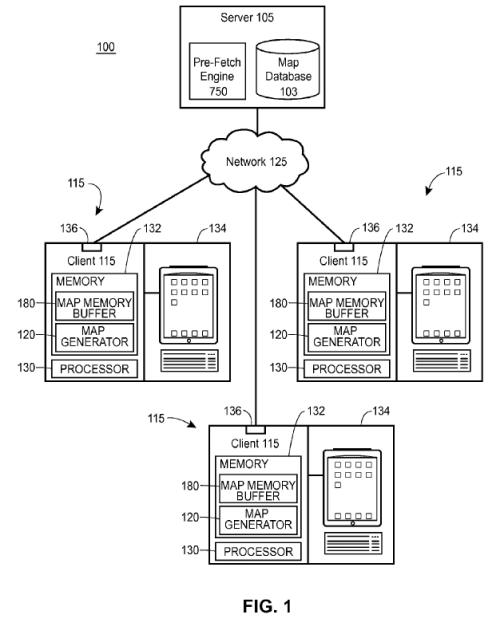
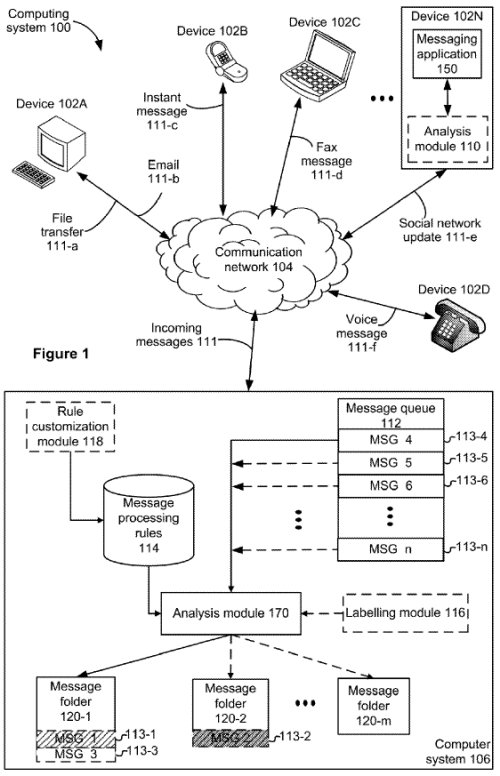
Figure 1 of US Patent No. 9,306,893 discloses a system diagram where the communication channels 111-a, 111-b, 111-c, etc are labeled with text. This is not required. Instead, nature of the communication at 111-a, 111-b, 111-c, etc could have been described in the text description.
These are just a few examples of system drawings.
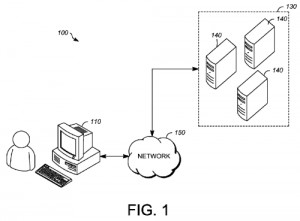
The first drawing at the top of the post is from U.S. Patent No. 9,307,033.